LIBROS PARA DESCARGAR

AIAS

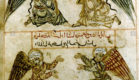
Imam Jomeini: La brisa del amanecer. En el Teatro Ateneo, CABA, viernes 5 de abril, 2024, dia de Palestina (Quds)
Entrevistada por la Dra. Olga Alvarez, En La Balanza. INVITADA Hindu Anderi, Periodista.Hablamos sobre PALESTINA
INVITADA Hindu Anderi Periodista. La Unidad de los Pueblos asegura Victorias para la Humanidad.
*Irán. Sheikh Abdul Karim Paz: «¡Qué se puede negociar con «Israel» y Estados Unidos, si nunca cumplen nada!»*
Entrevista realizada por : Carlos Aznárez Fuente: Resumen Latinoamericano 27 Mayo 2021 Como Cuba,...
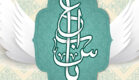
*»La noche del Decreto»*
Por el Sheij Abdul Karim Paz Link del video completo: https://youtu.be/7gWa-PZqd08?si=hXu1m90rlpo_kbh7
Jadiya -Maestra de la fe y resistencia de la mujer palestina
Conferencia a cargo de la Lic. Masuma Assad de Paz. Hauza Imam Ali. 23/3/24 Bismihi Ta’ala Jadiya, maestra...
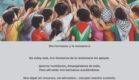
100 días de heroísmo y orgullo
Nuestros valientes luchadores entregan sus vidas al servicio de la libertad y dignidad. Llevamos 100 días...
¿Es posible la poesía después de Gaza?
Por José Antonio Martín Acosta -16/12/2023 Decía el filósofo Theodor Adorno que después...
Súplica de Abu Hamza al-Zumali
La Súplica de Abu Hamza al-Zumali es una letanía narrada por el Imam Sayyad (P). Es muy recomendable recitar...Risalat al Huquq, El Tratado de los Derechos – Imam ‘Ali Zayn al ‘Abidin
risalat_al_huquq_el_tratado_de_los_derechosDescargaLas súplicas del Imam Sayyad A.S. – Sahifatu Sayadiah
Sahifatu-sayadiahDescarga
Nacimiento la luna de Bani Hásim, Abul-Fadl Al-Abbás (AS)
Fuente: https://es.shafaqna.com/2023/02/25/nacimiento-la-luna-de-bani-hasim-abul-fadl-al-abbas-a-s/ Abbas ibn...
Una reflexión sobre las enseñanzas de la Escuela del Imam Sayyad (P)
En la Escuela del Imam Sayyad (P) la súplica y las letanías tienen una posición destacada. A través de estas...
Martirio de Hadrat Zainab (La paz sea con ella), Hija de Amir al Mu’minin (La paz sea con él)
El 15 de Rayab es el aniversario del martirio de la noble nieta de Hazrat Muhammad Mustafa (La Paz sea con él...
13 de Rayab Aniversario de Nacimiento del Imam Ali b. Abi Talib (La Paz sea con él)
Aquí daremos una breve reseña sobre aspectos destacados del Comandante de los Creyentes, (la paz sea con él...Ultimos Articulos
-
Imam Jomeini: La brisa del amanecer. En el Teatro Ateneo, CABA, viernes 5 de abril, 2024, dia de Palestina (Quds)
-
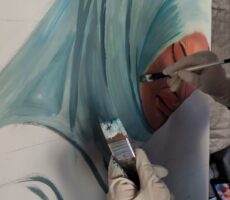
Estudiantes artistas dibujando temas respecto al Dia del Quds,5/4/2024. En la marcha en Qom.
-
Entrevistada por la Dra. Olga Alvarez, En La Balanza. INVITADA Hindu Anderi, Periodista.Hablamos sobre PALESTINA
-
*Irán. Sheikh Abdul Karim Paz: «¡Qué se puede negociar con «Israel» y Estados Unidos, si nunca cumplen nada!»*
-
*»La noche del Decreto»*
-
Jadiya -Maestra de la fe y resistencia de la mujer palestina
-
100 días de heroísmo y orgullo
-
¿Es posible la poesía después de Gaza?
-
Súplica de Abu Hamza al-Zumali
-
Risalat al Huquq, El Tratado de los Derechos – Imam ‘Ali Zayn al ‘Abidin
-
Las súplicas del Imam Sayyad A.S. – Sahifatu Sayadiah
-
Nacimiento la luna de Bani Hásim, Abul-Fadl Al-Abbás (AS)
-
Una reflexión sobre las enseñanzas de la Escuela del Imam Sayyad (P)
-
Martirio de Hadrat Zainab (La paz sea con ella), Hija de Amir al Mu’minin (La paz sea con él)
-
13 de Rayab Aniversario de Nacimiento del Imam Ali b. Abi Talib (La Paz sea con él)
BIENVENIDOS

- Caligrafia Islámica
- Clases de Filosofía Islámica
- Dictámenes
- Dictámenes Mes de Ramadán
- El rincón de la súplica y de la ziarat
- Mes de Dhul Hiyyah-Acciones preferibles
- Noticias
- Palestina
- Preguntas y Respuestas
- Secretaría de Derechos Humanos Islámicos
- Súplicas para cada día de la semana
- Vida de los Imames
- Vida de los Imames


Clases de Filosofía Islámica
A cargo del Sheij Abdul Karim Paz *Primera Clase https://www.facebook.com/100065475320911/videos/2294774397371086/?app=fbl *Segunda...

*»La noche del Decreto»*
Por el Sheij Abdul Karim Paz Link del video completo: https://youtu.be/7gWa-PZqd08?si=hXu1m90rlpo_kbh7
Leer el Sagrado Corán en el Mes de Ramadán
https://www.facebook.com/100065475320911/videos/522128353449449/

Normas del ayuno (leyes prácticas del ayuno)
A cargo del Sheij Abdul Karim Paz https://www.facebook.com/100065475320911/videos/786623912401338/?app=fbl

Las oraciones meritorias del
mes de Ramadan en palabras
del Imam ‘Ali (P)
Se transmitió de Muhammad ibn Ya‘far ibn Al-Husein Al-Majzumi, de Muhammad ibn...

Oraciones recomendadas para
cada noche del mes de
Ramadán
Según figura en el libro “Mafatih al-Yinan”, las siguientes son las oraciones...
*»La noche del Decreto»*
Por el Sheij Abdul Karim Paz Link del video completo: https://youtu.be/7gWa-PZqd08?si=hXu1m90rlpo_kbh7
Leer el Sagrado Corán en el Mes de Ramadán
https://www.facebook.com/100065475320911/videos/522128353449449/
Normas del ayuno (leyes prácticas del ayuno)
A cargo del Sheij Abdul Karim Paz https://www.facebook.com/100065475320911/videos/786623912401338/?app=fbl
Las oraciones meritorias del
mes de Ramadan en palabras
del Imam ‘Ali (P)
Se transmitió de Muhammad ibn Ya‘far ibn Al-Husein Al-Majzumi, de Muhammad ibn...
Oraciones recomendadas para
cada noche del mes de
Ramadán
Según figura en el libro “Mafatih al-Yinan”, las siguientes son las oraciones...

Súplica de Abu Hamza al-Zumali
La Súplica de Abu Hamza al-Zumali es una letanía narrada por el Imam Sayyad (P)....
Las súplicas del Imam Sayyad A.S. – Sahifatu Sayadiah
Sahifatu-sayadiahDescarga

Explicación de la súplica del día miércoles (Segunda parte)
Por Masuma Assad de Paz El por qué Al-lah es merecedor de alabanza: “¡Dios...

Súplica del día miércoles
¡Alabado sea Dios! Quien ha establecido la noche como manto y el sueño para descanso,...

Súplica de pedido de perdón
EN EL NOMBRE DEL ALTÍSIMO Siempre que tropieces, pide perdón. Siempre que...
Acciones preferibles para el resto del mes de Dhul Hiyyah
DÍA DECIMO OCTAVO 1era. PARTEEl 18 del mes de Dhul Hiyyah es el día...


¿Es posible la poesía después de Gaza?
Por José Antonio Martín Acosta -16/12/2023 Decía el filósofo...

British Airways revela un nuevo uniforme con opciones de hijab
LONDRES: British Airways ha presentado su primera nueva colección de uniformes...
Occidente no solo ha oprimido a las mujeres, también ha sido hipócrita en su accionar
El líder hizo las observaciones durante una reunión con cientosde destacadas mujeres...

«Amir Nasr-Azadani» , futbolista iraní acusado de rebelión, era miembro de un grupo armado.
El Presidente del Tribunal Supremo de la provincia de Isfahan dio una explicación...

Irán. Maratón mediático «Irán por la verdad»: Entrevista a Masuma Assad de Paz, mujer argentina que viven en Qom
Resumen Latinoamericano, 9 de diciembre de 2022. En este maratón auspiciado...

Entrevistada por la Dra. Olga Alvarez, En La Balanza. INVITADA Hindu Anderi, Periodista.Hablamos sobre PALESTINA
INVITADA Hindu Anderi Periodista. La Unidad de los Pueblos asegura Victorias para...

*Irán. Sheikh Abdul Karim Paz: «¡Qué se puede negociar con «Israel» y Estados Unidos, si nunca cumplen nada!»*
Entrevista realizada por : Carlos Aznárez Fuente: Resumen Latinoamericano 27...

100 días de heroísmo y orgullo
Nuestros valientes luchadores entregan sus vidas al servicio de la libertad y dignidad. Llevamos...
Preguntas y Respuestas Nº38 ¿Qué importancia tienen los ángeles en la religión islámica?
“¡En el Nombre de Allah, el Compasivo, el Misericordioso! بِسْمِ اللَّهِ...

¿Por qué Allah creó el prepucio que es removido durante la circuncisión?
PREGUNTA: Si Allah (swt) no deseaba que los hombres se dejaran el prepucio, entonces,...

¿Puede el alma después de la muerta informarse respecto a los sucesos y asuntos del mundo?
Preguntas y Respuestas #36 ¿Puede el alma después de la muerta informarse respecto...

¿Qué significa kirâmah (generosidad)? ¿Cómo puede uno ser generoso? Y ¿de qué jerarquía gozan las personas generosas ante Dios?
Preguntas y Respuestas Nº 35 ¿Qué significa kirâmah (generosidad)? ¿Cómo puede...

Desde el punto de vista de las narraciones ¿cómo debe comportarse con los no musulmanes?
*Preguntas y Respuestas Nº 34* Desde el punto de vista de las narraciones ¿cómo...
¿Es posible la poesía después de Gaza?
Por José Antonio Martín Acosta -16/12/2023 Decía el filósofo...
Risalat al Huquq, El Tratado de los Derechos – Imam ‘Ali Zayn al ‘Abidin
risalat_al_huquq_el_tratado_de_los_derechosDescarga

1° de febrero – Dia Mundial del Hiyab
Felicidades a todas las hermanas musulmanas en el día del hiyab. Dia de la mujer...
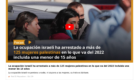
La ocupación israelí ha arrestado a más de 125 mujeres palestinas en lo que va del 2022 incluida una menor de 15 años (video)
LINK AL VIDEO: https://espanol.almayadeen.net/video/1643502/la-ocupaci%C3%B3n-israel%C3%AD-ha-arrestado-a-m%C3%A1s-de-125-mujeres-pales
Explicación de la súplica del día miércoles (Segunda parte)
Por Masuma Assad de Paz El por qué Al-lah es merecedor de alabanza: “¡Dios...
Súplica del día miércoles
¡Alabado sea Dios! Quien ha establecido la noche como manto y el sueño para descanso,...

Súplica del día martes
¡Las alabanzas pertenecen a Dios, y son Su derecho exclusivo! Profusas alabanzas,...

Súplica del día lunes
Alabado sea Dios, Aquel que no tuvo testigos cuando creó los Cielos y la Tierra!...
Nacimiento la luna de Bani Hásim, Abul-Fadl Al-Abbás (AS)
Fuente: https://es.shafaqna.com/2023/02/25/nacimiento-la-luna-de-bani-hasim-abul-fadl-al-abbas-a-s/ Abbas...

Una reflexión sobre las enseñanzas de la Escuela del Imam Sayyad (P)
En la Escuela del Imam Sayyad (P) la súplica y las letanías tienen una posición...

Testamento del Imam Ali a.s. antes de morir (luego de que Ibn Mulyam le produzca una herida letal con su sable).
Carta número 47 Cuando Abdul Rahman Ibn Mulyam le produjo una herida letal...
Vida de los Imames
A cargo del Sheij Abdul Karim Paz https://www.facebook.com/100065475320911/videos/1609439422851037/?app=fbl
Aleyas y Exégesis
-

Interpretación del Sagrado Corán. Sura 3, aleyas 17, 18 y 19
A cargo del Sheij Abdul Karim Paz https://www.facebook.com/100065475320911/videos/791059185558527/?app=fbl
- Interpretación del Sagrado Corán, Sura 3, aleyas 7, 8 y 9
- Interpretación del Sagrado Corán, sura 3 aleyas 4, 5 y 6.
Caligrafia Islámica
-

Muestra de Caligrafía Islámica
Autora: Dunia Elizabeth Saleh
Clases de Filosofía Islámica
-
Clases de Filosofía Islámica
A cargo del Sheij Abdul Karim Paz *Primera Clase https://www.facebook.com/100065475320911/videos/2294774397371086/?app=fbl *Segunda clase https://www.facebook.com/100065475320911/videos/771803230976755/?app=fbl *Tercera clase… more
Cultura
-

100 días de heroísmo y orgullo
Nuestros valientes luchadores entregan sus vidas al servicio de la libertad y dignidad. Llevamos 100… more
- 1° de febrero - Dia Mundial del Hiyab
- Mis hermanos y la resistencia
Derecho
-
100 días de heroísmo y orgullo
Nuestros valientes luchadores entregan sus vidas al servicio de la libertad y dignidad. Llevamos 100… more
- ¿Es posible la poesía después de Gaza?
- Risalat al Huquq, El Tratado de los Derechos - Imam 'Ali Zayn al 'Abidin
Dictámenes
-

*»La noche del Decreto»*
Por el Sheij Abdul Karim Paz Link del video completo: https://youtu.be/7gWa-PZqd08?si=hXu1m90rlpo_kbh7
- Leer el Sagrado Corán en el Mes de Ramadán
- Normas del ayuno (leyes prácticas del ayuno)
Dictámenes Mes de Ramadán
-
*»La noche del Decreto»*
Por el Sheij Abdul Karim Paz Link del video completo: https://youtu.be/7gWa-PZqd08?si=hXu1m90rlpo_kbh7
- Leer el Sagrado Corán en el Mes de Ramadán
- Normas del ayuno (leyes prácticas del ayuno)
Económico
-
Los Dones del Islam al Mundo
Por el Sayyid Mujtaba Musava Lari Islam El Islam aboga por la armonía y… more
- La Importancia del Trabajo en el Islam
- El alcoholismo: una cuestión de economía política
El rincón de la súplica y de la ziarat
-

Súplica de Abu Hamza al-Zumali
La Súplica de Abu Hamza al-Zumali es una letanía narrada por el Imam Sayyad (P)…. more
- Las súplicas del Imam Sayyad A.S. - Sahifatu Sayadiah
- Explicación de la súplica del día miércoles (Segunda parte)
Familia
-

«La vida de los seres humanos está en manos de las madres»
El líder supremo de la República Islámica, el Ayatolá Seyed Alí Khameneí, en su discurso… more
- El rol de la familia en el fortalecimiento y el desarrollo de la espiritualidad
- El Estatus de las Mujeres en la República Islámica de Irán
Feminismo
-

Promoción y Protección del Estatus de las Mujeres
En el nombre de Allah el Misericordioso, el Compasivo Promoción y Protección del Estatus de… more
- Presidente Correa critica ideología de género: "es peligrosísima"
- Análisis de Ayatollah Mutahari Sobre las Cuestiones Actuales de la Mujer
Grandes Mujeres
-

Jadiya -Maestra de la fe y resistencia de la mujer palestina
Conferencia a cargo de la Lic. Masuma Assad de Paz. Hauza Imam Ali. 23/3/24 Bismihi… more
- Celebración del Matrimonio celestial del Imam Ali (P) y la digna Dama Fátima Zahra (P)
- RUQAIAH (S)

Hiyab
-

1° de febrero – Dia Mundial del Hiyab
Felicidades a todas las hermanas musulmanas en el día del hiyab. Dia de la mujer… more
- Los siete artículos del reglamento de baño de 1888
- Arte Islámico - Día Internacional del Hiyab
Islamofobia
-

Occidente no solo ha oprimido a las mujeres, también ha sido hipócrita en su accionar
El líder hizo las observaciones durante una reunión con cientosde destacadas mujeres iraníes en la… more
- Querida Francia
- DIA MUNDIAL DEL HIYAB (video)
Mes de Dhul Hiyyah-Acciones preferibles
-

Acciones preferibles para el resto del mes de Dhul Hiyyah
DÍA DECIMO OCTAVO 1era. PARTEEl 18 del mes de Dhul Hiyyah es el día de… more
- Acciones preferibles para los primeros diez días del mes de Dhul Hiyyah
Moral y Familia
-

Los siete artículos del reglamento de baño de 1888
Primer reglamento creado para las playas de Mar del Plata, Argentina. Agradecemos a la hermana… more
- El velo islámico
- «La vida de los seres humanos está en manos de las madres»
Palestina
-
Imam Jomeini: La brisa del amanecer. En el Teatro Ateneo, CABA, viernes 5 de abril, 2024, dia de Palestina (Quds)
- Estudiantes artistas dibujando temas respecto al Dia del Quds,5/4/2024. En la marcha en Qom.
- Entrevistada por la Dra. Olga Alvarez, En La Balanza. INVITADA Hindu Anderi, Periodista.Hablamos sobre PALESTINA
Política
-

¿Es posible la poesía después de Gaza?
Por José Antonio Martín Acosta -16/12/2023 Decía el filósofo Theodor Adorno que después de… more
- "Amir Nasr-Azadani" , futbolista iraní acusado de rebelión, era miembro de un grupo armado.
- Irán. Maratón mediático «Irán por la verdad»: Entrevista a Masuma Assad de Paz, mujer argentina que viven en Qom
Práctica Islámica
-
Los siete artículos del reglamento de baño de 1888
Primer reglamento creado para las playas de Mar del Plata, Argentina. Agradecemos a la hermana… more
- ¿Quién ha causado el mayor perjuicio a la mujer?
- El gato según el Islam
Preguntas y Respuestas
-

Preguntas y Respuestas Nº38 ¿Qué importancia tienen los ángeles en la religión islámica?
“¡En el Nombre de Allah, el Compasivo, el Misericordioso! بِسْمِ اللَّهِ الرَّحْمَنِ الرَّحِيم Preguntas y… more
- ¿Por qué Allah creó el prepucio que es removido durante la circuncisión?
- ¿Puede el alma después de la muerta informarse respecto a los sucesos y asuntos del mundo?
Religión
-
*»La noche del Decreto»*
Por el Sheij Abdul Karim Paz Link del video completo: https://youtu.be/7gWa-PZqd08?si=hXu1m90rlpo_kbh7
- Nacimiento la luna de Bani Hásim, Abul-Fadl Al-Abbás (AS)
- Una reflexión sobre las enseñanzas de la Escuela del Imam Sayyad (P)
Salud
-

¿En qué mes se recolecta el agua de Nissan? ¿Qué es el agua de Nissan?
Traducido del persa por: Masuma Assad de Paz El séptimo mes del calendario asirio se… more
- Si, soy una entrenadora personal que usa hiyab, ¿y qué?
- Sabías que desde los comienzos del Islam existieron mujeres que ejercieron la enfermería, las cuales contaban con altos conocimientos en medicina?
Secretaría de Derechos Humanos Islámicos
-
¿Es posible la poesía después de Gaza?
Por José Antonio Martín Acosta -16/12/2023 Decía el filósofo Theodor Adorno que después de… more
- Risalat al Huquq, El Tratado de los Derechos - Imam 'Ali Zayn al 'Abidin
- 1° de febrero - Dia Mundial del Hiyab
Social
-

Una reflexión sobre las enseñanzas de la Escuela del Imam Sayyad (P)
En la Escuela del Imam Sayyad (P) la súplica y las letanías tienen una posición… more
- Mis hermanos y la resistencia
- Los siete artículos del reglamento de baño de 1888
Súplicas para cada día de la semana
-

Explicación de la súplica del día miércoles (Segunda parte)
Por Masuma Assad de Paz El por qué Al-lah es merecedor de alabanza: “¡Dios mío!… more
- Súplica del día miércoles
- Súplica del día martes
Vida de los Imames
-

Nacimiento la luna de Bani Hásim, Abul-Fadl Al-Abbás (AS)
Fuente: https://es.shafaqna.com/2023/02/25/nacimiento-la-luna-de-bani-hasim-abul-fadl-al-abbas-a-s/ Abbas ibn Alí (en árabe : العباس بن علي), también conocido como Abul Fazl (en… more
- Una reflexión sobre las enseñanzas de la Escuela del Imam Sayyad (P)
- Testamento del Imam Ali a.s. antes de morir (luego de que Ibn Mulyam le produzca una herida letal con su sable).
Vida de los Imames
-

Testamento del Imam Ali a.s. antes de morir (luego de que Ibn Mulyam le produzca una herida letal con su sable).
Carta número 47 Cuando Abdul Rahman Ibn Mulyam le produjo una herida letal a Hazrat… more
- Vida de los Imames
